
Illustration by unDraw
Minimising Layout and Layout thrashing for 60 FPS
Minimising Layout / reflow and Layout thrashing events in the browser for smoother experiences on the web.
An experience is often characterised as "webby" when it feels janky during scroll, animations or transitions. In the modern web, having a Progressive Web App (PWA) that a user can launch from the homescreen, it is expected that the web app is fast and has a 60 frames-per-second (FPS) smoothness without feeling janky.
In this article, we will be looking at a few ways by which Layout / reflow events might occur, why they are bad, how to track such events and how to optimise for blazing fast frame rate on the web.
We will be diving into various ways that we can optimise a site and reach 60 frames per second (FPS) - 16 ms per frame - or even 90 and 120 FPS for newest mobile phones, while the user interacts with or loads a page. We will also be looking at how we can use advanced tools within Chrome DevTools to locate and analyse performance bottlenecks.
Prerequisites#
For the rest of this article, I will assume you are comfortable with front-end development components such as CSS, the Browser DOM, and accessing HTML elements using JavaScript.
I will also assume you have a basic understanding of Chrome DevTools as we will be diving in deeper later on.
What is Layout, reflow, Layout thrashing and Layout Shift?#
In order to simplify things and give some clarity around the different browser processes and names, let us go through them and make sure we are referring to the correct items throughout this article:
- Layout or reflow: It's the act of figuring out the rects for everything (or a subset) in the document
- Layout shift: When 1. results in a noticeable shift of elements within the viewport
- Unwelcome layout shift: when 2. results in a bad visual experience.
- Layout thrashing or uninterruptible reflow or forced reflow: A series of layout or reflow (1.) events usually resulting in slow frame rendering times (low FPS)
It is important here to note that even though Layout (1.) is essential for laying out all elements in the screen, when requested multiple times from the browser synchronously, it can be detrimental to runtime performance (4.). In this article we will be focusing mostly on these.
If you would like to learn more about how to improve Unwelcome layout shifts (2. and 3.) have a look at the Cumulative Layout Shift (CLS) and Optimise Cumulative Layout Shift articles to learn more about it.
So what exactly is this Layout thingy?
Simply put, layout is a synchronous and main thread blocking operation that computes dimensions and positions for all elements in a document.
When it happens#
For a detailed list, check out this list of CSS properties that trigger layout, painting, and composition and this list of JavaScript tasks that trigger layout.
The layout avalanche effect#
Warning: Flashing images follow!
In some cases, we have to be extremely careful on the front-end when it comes to rendering or adding interactions to a number of list items.
Say for example, we are rendering a long list of 20 image-links in a page that change styles on hover. Hovering over one image can cause layout and layout shift, but it could end up into a layout avalanche effect when the rest 19 images in the page are "pushed" left and right due to the first image's new position and/or dimensions.
In this CSS grid of list items for example, let's say that I change the width and height of each item on hover:
.gridItem:hover {
  width: calc(100% + 20px);
  height: calc(100% + 20px);
}The above CSS styles will result, as mentioned above, a layout avalanche affecting all items in the grid list:
Warning: Observe the flashing blue boxes on the screen which signify layout shifts. Apart from being a bad user experience, this can slow down the browser when rendering frames as it has to re-paint and re-calculate each item's position on the screen!
If we were to fix this, we could use CSS transforms in this case - could be different in your case though. The main idea is to preserve enough space before hand and scale each item using CSS transforms that are causing composited animations:
.gridItem {
  transform: scale(1);
  transition: transform 0.3s;
}

.gridItem:hover {
  transform: scale(1.05);
}This will fix the layout avalanche effect and result in no layout whatsoever by the browser as shown below:
Why it is bad#
Layout thrashing or forced reflow can be the cause of bad user experience, in terms of elements shifting around while the user tries to read or interact with the page or by reducing our site’s frame rate resulting in a janky "webby" feel.
In short:
- May increase CLS
- May increases First Contentful Paint (FCP) times
- Requires CPU power
- It is a main-thread-blocking operation
- Creates a bad user experience, as a result of all the above
I know. If you haven’t heard about this layout thing before, you must be panicking right now as you are risking triggering unwanted layout whenever you want to manipulate the DOM.
But the truth is that the browser might not trigger Layout for every DOM manipulation and on the other hand layout is sometimes inevitable, no matter how hard you try. Our objective here is to try and minimise the occurrences of layout and not prevent it altogether - that would be impossible.
Layout thrashing or forced reflows on the other hand shouldn't occur anywhere in our web app.
Best practise: We can strive by optimising for speed and optimum user experience by minimising the number of layout occurrences and by mitigating their effects. We should then remove any Layout thrashing or forced reflows to make sure our users are getting the highest FPS possible.
Minimise Layout Events#
JavaScript makes it so easy to manipulate the DOM in a dynamic manner. Though sometimes it is also easy to forget that it comes at a cost.
Now let’s go into some ways by which we can write code differently and trigger as few Layouts as possible.
Edit elements closest to the DOM tree tip#
Due to the Layout avalanche effect but not only, it’s recommended to trigger the Layout as low in the DOM tree as possible to minimise subsequent Layouts and Paints that might get triggered on children elements.
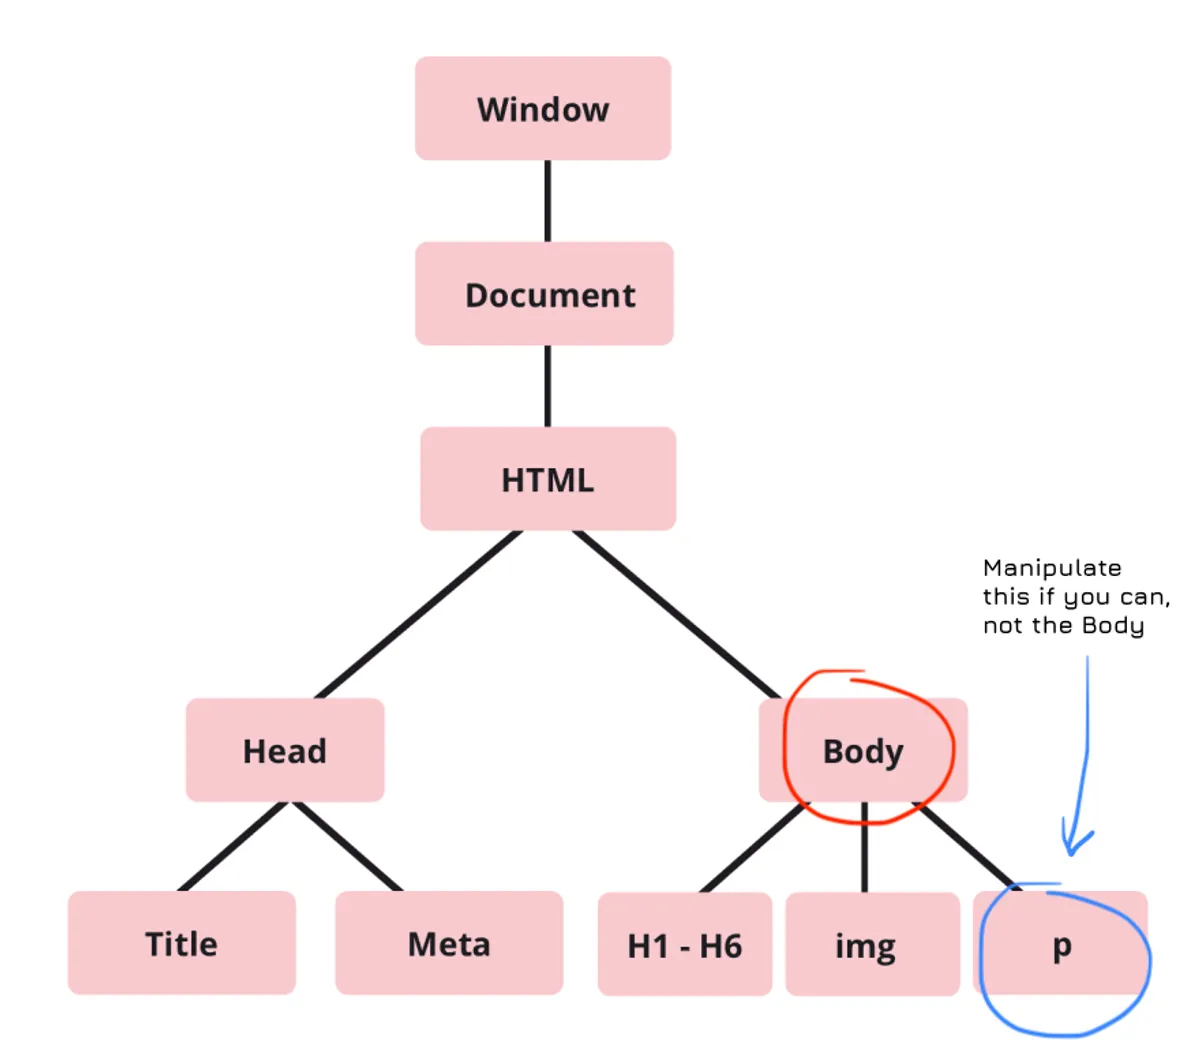
Say you want to toggle a class in order to apply a set of CSS styles, do so always on the element you want to apply the styles to, not on any of its parent elements.
Keeping your DOM tree as simple as possible will also get you some speed benefits. Try to use as few wrapper elements as possible throughout your HTML and don’t create unnecessary elements.
Tip: Additionally, there is an interesting specification called CSS containment that allows us to isolate a subtree of the page from the rest of the page. Read more about it on MDN docs.
Measure once#
Check your code for repeated width calculations of elements such as element.offsetWidth or $('element').width(). For the good and bad examples below I have tested them against the "Latest blog posts" list in my portfolio website homepage:
bad-code.jsvar list = document.getElementById('list');
var listItems = Array.from(list.children);
for (const listItem of list.children) {
var listParentHeight = list.parentElement.offsetHeight; // No-No: read parent height in every loop after it has changed in the next line
listItem.style.marginTop = Math.floor( listParentHeight / listItems.length - 10) + 'px';
}❌ CLS value = 0.276
Code is unoptimised, as it is calculating an element’s height and changing its margin in a loop.
Now let's look at how we can bring the CLS value down, while altering the DOM with exactly the same styles:
good-code.jsvar list = document.getElementById('list');
var listParent = list.parentElement;
var listParentHeight = listParent.offsetHeight; // Yes-Yes: store height of parent element
var removedList = listParent.removeChild(list); // Yes-Yes: remove list for batch editing
var listItems = Array.from(removedList.children);
for (const listItem of list.children) {
listItem.style.marginTop = Math.floor( listParentHeight / listItems.length - 10) + 'px';
}
listParent.appendChild(removedList); // add the list back after editing✅ CLS value = 0.040
Code is optimised as it is storing the value of the element’s height and using that instead in the loop. Also removes the element before editing its margin and adds it back to the DOM after the loop has finished.
Tip: To measure the CLS in both cases above, I have used a short Chrome snippet and you can check it out here.
Best practise: You may run the risk of writing more code and it ending up being unreadable. So make sure to wrap the process in a function with a sensible name, and add a comment that explains the function is performance-optimised.
Absolute position elements that change too often#
If there are any elements in your site that change their layout too often, they might be affecting other element’s layout as well which will trigger a cascading layout effect (e.g. layout avalanche).
For example, when animating an element’s dimensions (i.e. transforming and scaling), it is best to position that element using one the following properties:
position: fixedposition: stickyposition: absolute
This way the animating element will not affect the elements around it while changing its dimensions, thus reducing the number of unwanted layouts.
Use flexbox and avoid floats#
As seen in this comparison by Paul Lewis, there is a slight performance improvement (3.5ms vs. 14ms) when using flexbox instead of floats. However, this comparison may not reveal much if you take into account that 1,300 elements were rendered — a massive number not often found on most websites.
Warning: If there are around or more than 1,000 elements in any parts of your website, you should consider lowering their number since it is a culprit for many performance issues.
Even then, make sure to try out different layout techniques, and see which one is more performant in your case. Remember: measure, identify, fix, and repeat.
Anyway, what you should keep in mind is to set a fixed width and height whenever possible and to make sure that the layout doesn’t change if new elements are added to or removed from a container.
Change visibility instead of display#
When possible, hide or show the element using visibility: hidden and visibility: visible instead of display: none and display: block.
The key to this is that when setting visibility to hidden, the element will still take up space within the DOM layout. This way, contrary to altering the display property, the element’s dimensions will not change, so the browser doesn’t need to recalculate the layout.
So in cases that it’s not necessary to remove the element from the layout, just use visibility: hidden, and you will save yourself a couple of layouts.
Use textContent instead of innerText#
This is an interesting one. When requesting the text of a DOM element, you can do it in two ways: element.textContent, which returns all the text inside an element as hidden or visible, or you could get it by using element.innerText, which triggers a layout when calculating the element’s dimensions and before returning the visible text.
What you should take from this is that innerText has more performance implications than textContent, and if you can avoid using it in your code, it will lower the number of layout occurrences and increase the performance of your site. Just be careful in their difference of their outputs!
Avoid non-composited animations#
The browser's algorithms for converting HTML, CSS, and JavaScript into pixels are collectively known as the rendering pipeline.

What we would like to avoid here are the Style, Layout and Paint processes of the rendering pipeline and have the browser execute only the Composite part during animations, so that our animations don’t feel janky.
The key takeaway is to use the opacity and transform properties for animations whenever possible, instead of properties that cause non-composited animations e.g. width, height, top, left, etc.
Read more about non-composited animations on web.dev.
Tip: Learn more about how to create high-performance CSS animations and why some animations can be slow on web.dev.
Use requestAnimationFrame for visual changes#
Since we are talking about high frame rates and have already mentioned animations above, we should be definitely mentioning requestAnimationFrame as well.
The requestAnimationFrame callback is providing us with a way to run our code right at the beginning of a new frame, rather than executing code at random times and possibly extending the time of a single frame to more than 16 ms.
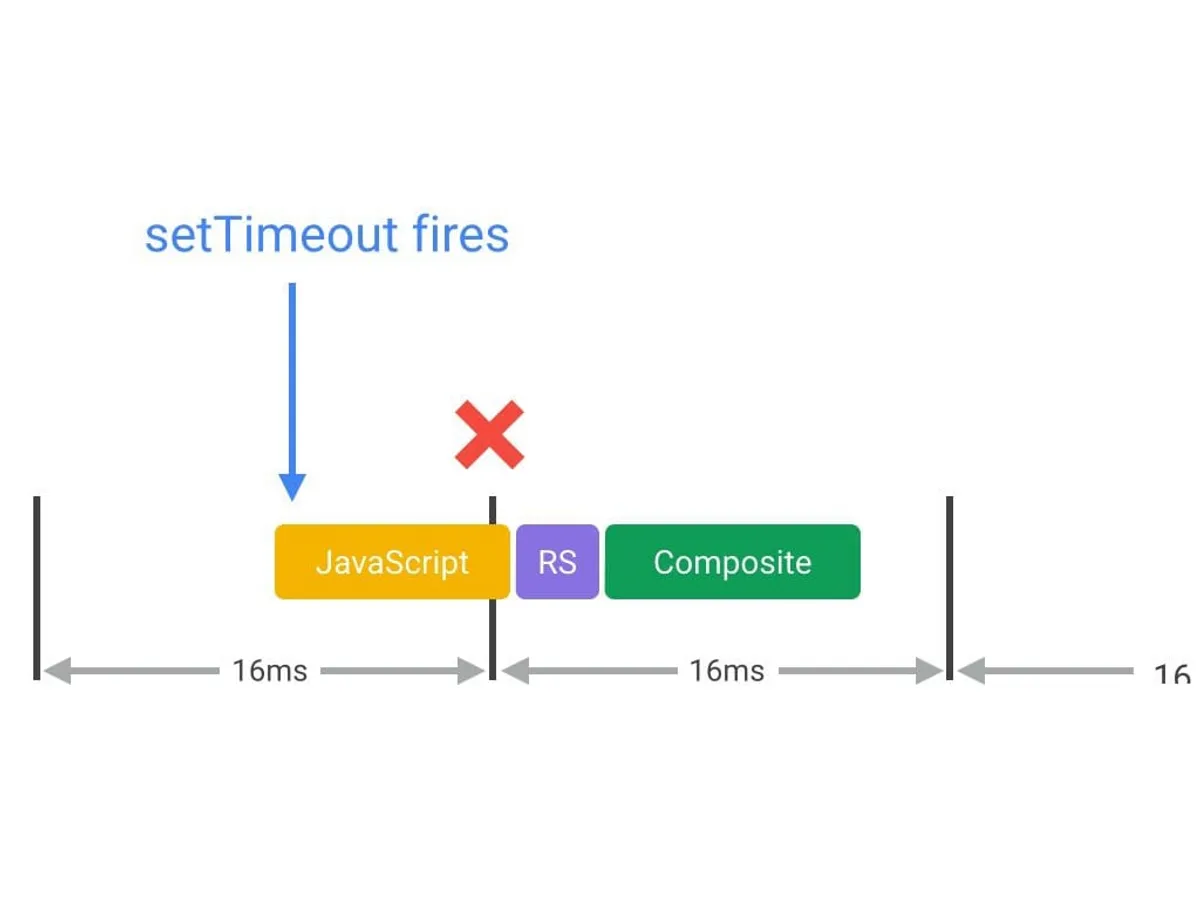
This function can be used not only for animations but for any visual change in the DOM. Though make sure to split any big tasks, that are changing the DOM, into smaller ones to save some time for the browser to carry out the remaining processes (i.e. Style, Layout, Paint) before creating a new frame.
function updateScreen(time) {

  // Make visual updates here.
}

requestAnimationFrame(updateScreen);If run as a requestAnimationFrame callback, the code will run at the start of a new frame. For a live example look at the animateBoxes function in this glitch.
Browser support#
If the requestAnimationFrame browser support is not what you are after, here is a polyfill by Paul Irish on Github. Also in case you are using an older version of jQuery 3.0, patch it to use requestAnimationFrame.
Learn more about using requestAnimationFrame for visual changes on Google Developers.
Warning: Do not userequestIdleCallbackto make visual changes to the DOM in the same fashion asrequestAnimationFrame! You will be risking a forced synchronous layout shift. Learn more about it here.
Promote elements into their own Layer#
Browsers will try to break up elements into separate Layers so that Painting and Layout calculations can be carried out efficiently, without unnecessary elements being affected.
To learn more about how to use the Layers tab within Chrome DevTools shown above, look at the "Using the Layers tab in Chrome DevTools" section below.
Say for example, you have a modal element that has initially the position: absolute CSS property, some browsers will promote the modal element into its own layer. That is of course to prevent future unnecessary re-paints and re-layouts of other unaffected - since it is absolutely positioned - elements on the page after the modal’s Layout or Paint has been altered.
But browsers do not always know what it is expected beforehand given our ever increasing complex web components.
Luckily there are quite a few CSS properties that we can utilise to manually promote elements into their own layers, letting the browser know how to handle those elements while saving some layout in the process:
will-change: transformtransform: translate3d(0,0,0)transform: translateZ(0)backface-visibility: hidden
Best practise: The most common recommendation you will read about the above properties is to keep them at a minimum and use only where necessary. And that’s a good idea. That’s for the same reason you wouldn’t oversleep - too much of it and you feel sluggish again 🥱
Head to this article and this section of Google Developers for more info on layer count.
Measuring FPS#
Measurement is an important step in the optimisation process of your site so measuring before and after any changes to the code can prove to be helpful for keeping track of what is working and what isn’t.
Identifying which elements or processes are causing Layout calculations and re-paints can be quite difficult. For this process, there are a number of tools available within the Chrome DevTools that can help us visualise and track down almost every process that happens inside the browser.
Note: What works on a certain website doesn’t necessarily work for another and you might have to try different approaches depending on your situation. Good measurement and identification skills can save you some headaches in the process.
The FPS meter#
The FPS meter within Chrome DevTools can help us identify any areas of improvement while monitoring a site in real-time for any dropped frames and dips of a site's frame rate.
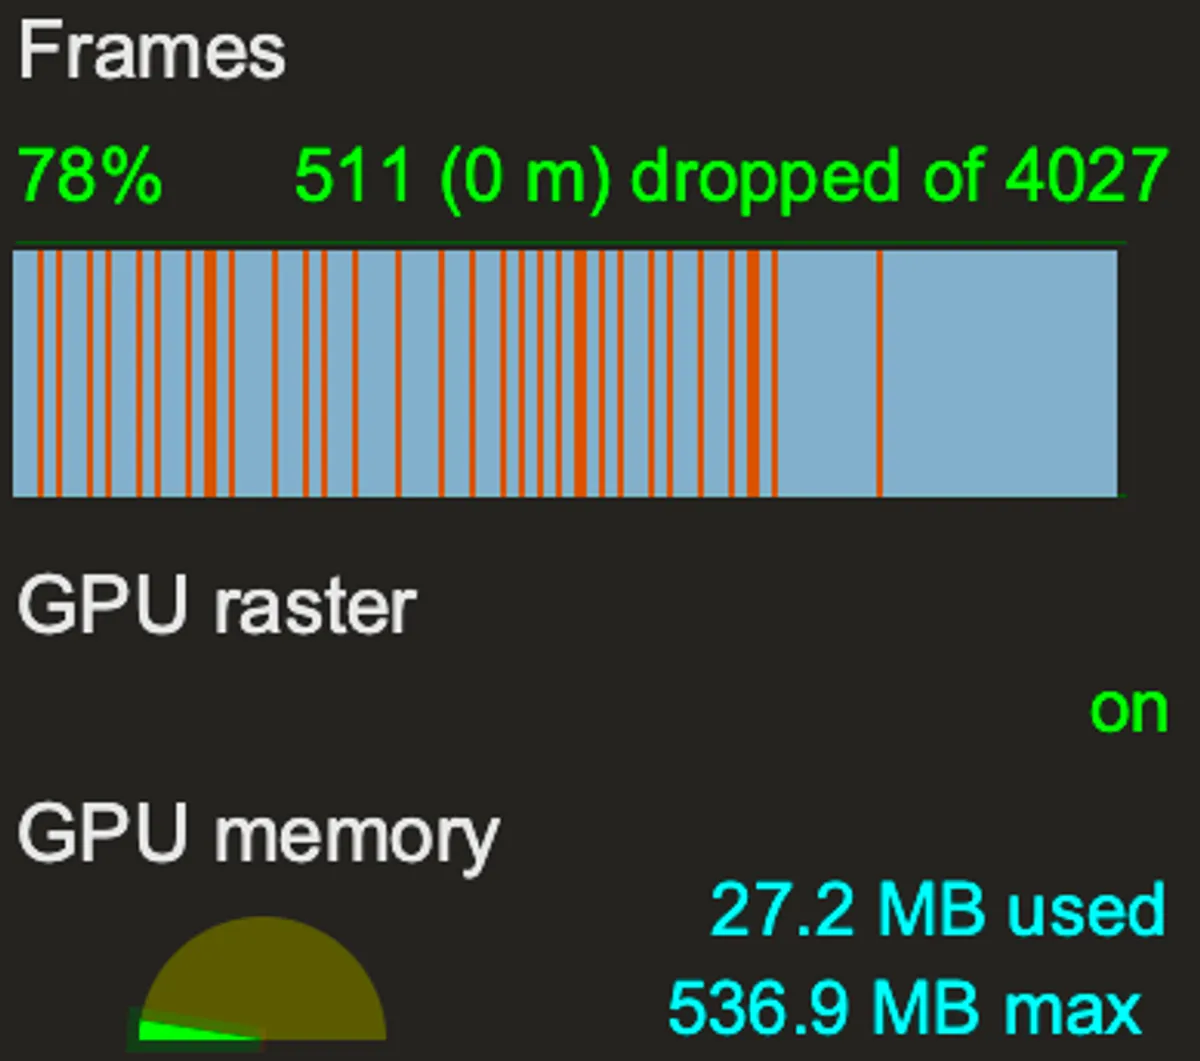
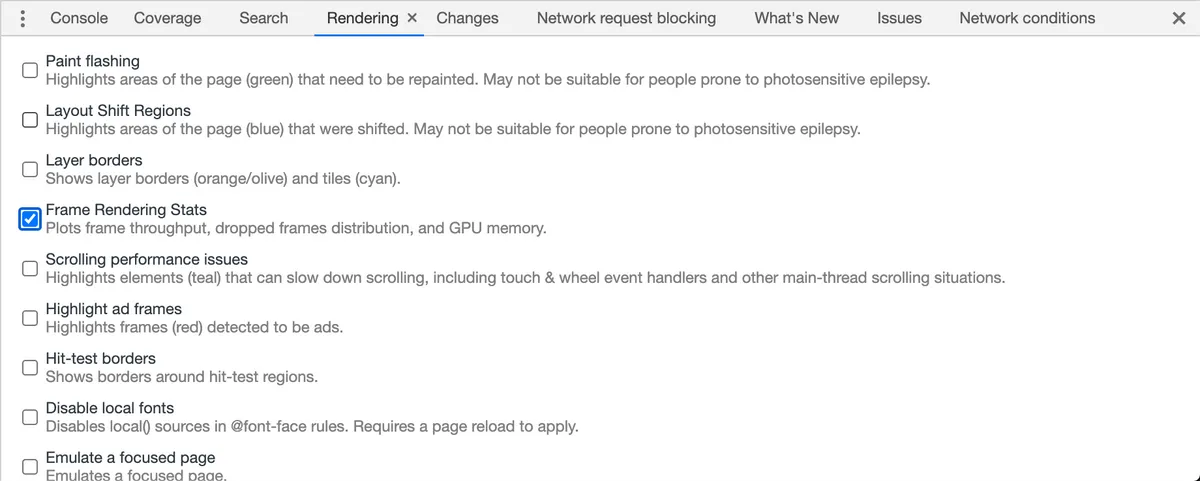
To enable the FPS meter in Chrome DevTools, open the Rendering tab and check the Frame Rendering Stats option. If you don’t see the bottom panel, press Esc to bring it up and open the Rendering tab from the options menu:
Here is an example of the FPS meter while navigating around in the web.dev site:
Highlight layout shift regions#
You will most certainly find useful to highlight the elements that are shifting throughout your website. These shifting elements will not always be visible elements and not necessarily being counted towards CLS (CLS counts only visible layout shifts). The reason then why these invisible or minor layout shifts are bad is because they are causing unnecessary calculations by the browser, thus bringing our frame rate down.
To enable this feature in Chrome DevTools, follow either of the following methods:
- From the Rendering tab, as in the FPS meter example above, check the "Layout Shift Regions" option.
- Or, within DevTools type cmd + shift + P on macOS ( ctrl + shift + P on Windows) to bring up the Command Palette. Then type "layout" to search and choose the "Show layout shift regions" option.
After you have enabled this feature, you should see elements highlighted in blue each time there is a layout shift happening as shown above in the example of amazon.co.uk.
Using the Performance tab in Chrome DevTools#
Now for getting to the heart of which processes are causing expensive Layout and Paint events, we will then have to look at the brilliant Performance tab of Chrome DevTools.
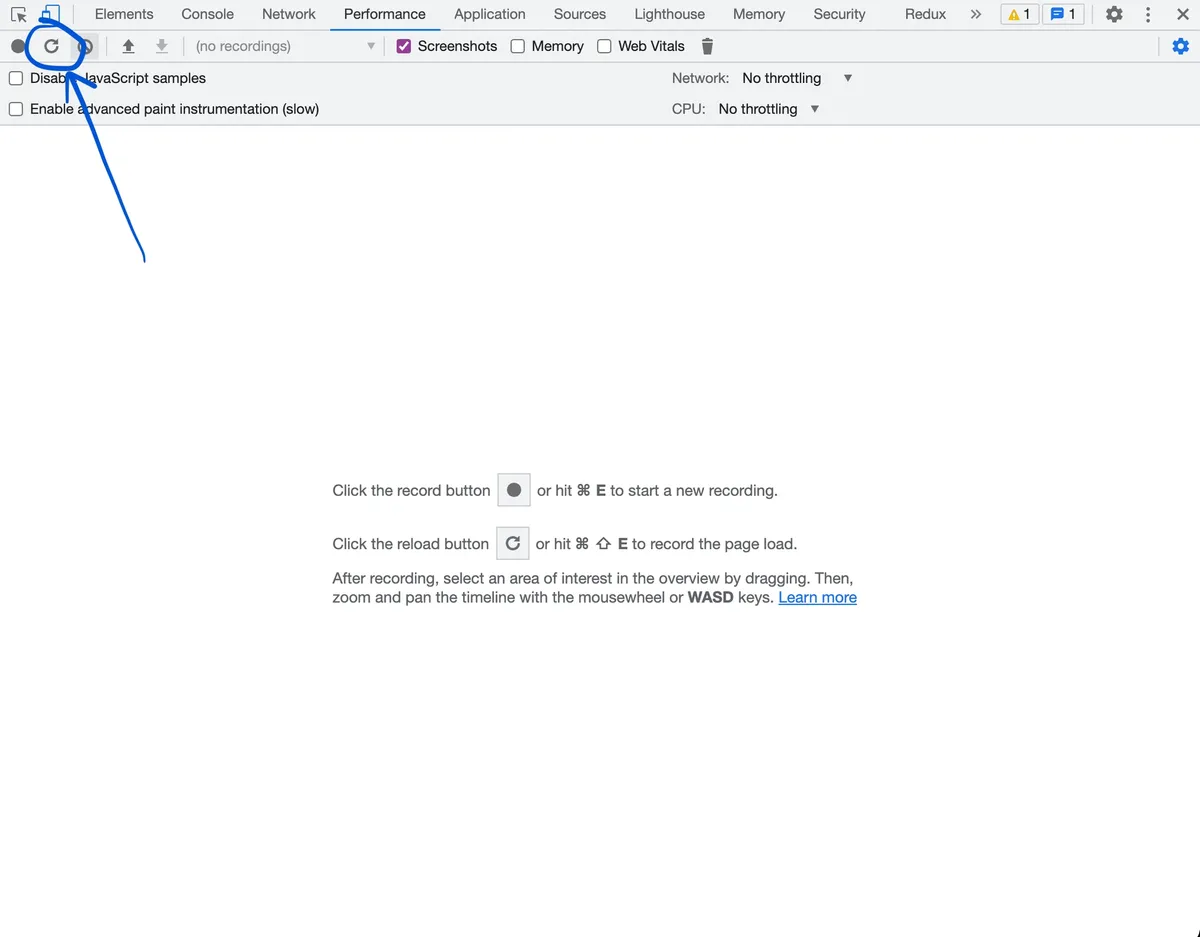
After you have opened the Performance tab, click on the reload button 🔄 on the top left corner. This will refresh your site and measure its performance until the CPU is idle. You should end up with something like this:
At first the Performance tab can seem overwhelming but the more you use it the easier it will be to understand it.
Tip: For a "clean" reload, remove all elements from the DOM and all event listeners before hitting the reload button. I made a Chrome Snippet for that to make my life easier - check it out here.
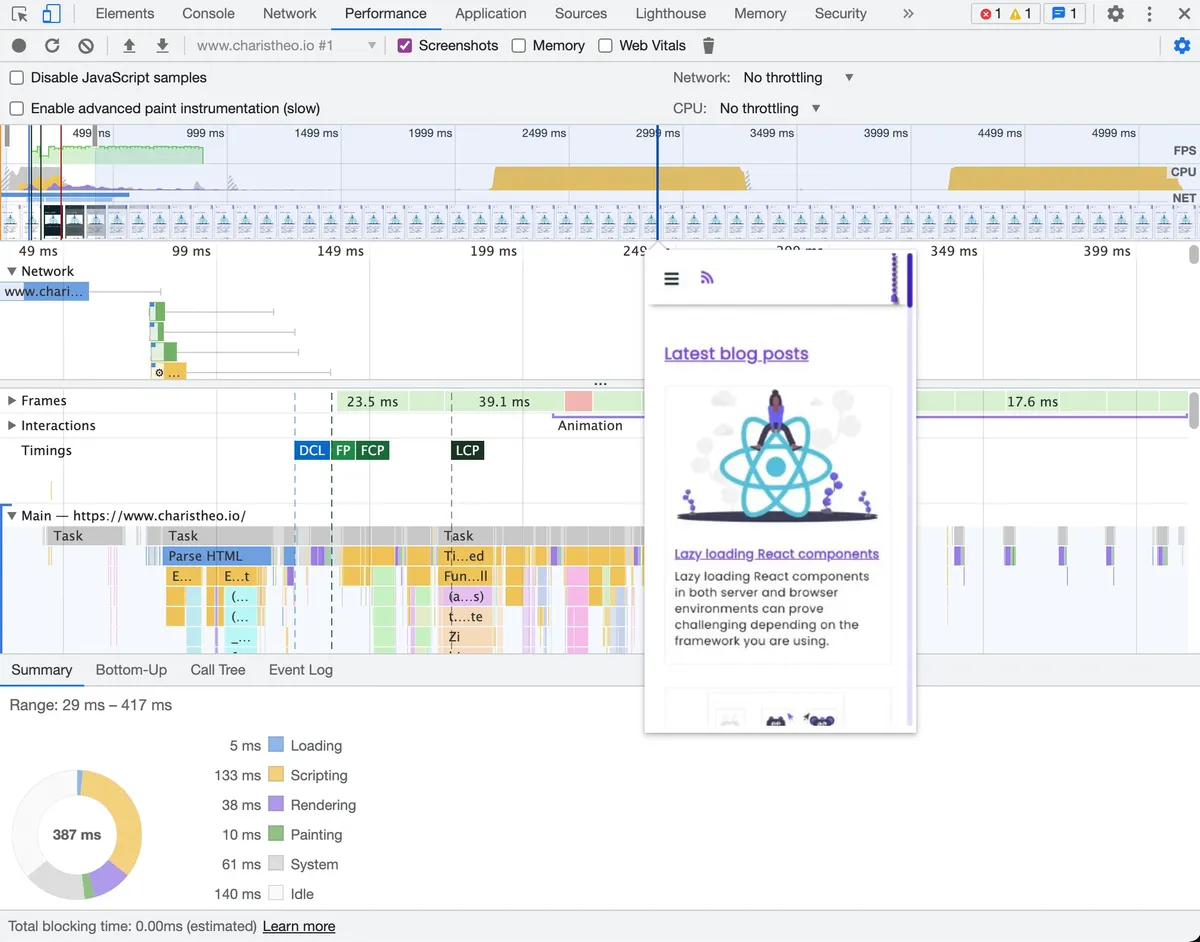
Try spending some time with it and see how each of the tasks appear in the main thread (Main - https://www.example/com section) as scripts and stylesheets are being downloaded (Network section) and the page loads (series of frames on the topmost section of the tab).
On the very top, we can see a timeline of every event with each type in a different color (i.e. yellow for scripting, purple for rendering and green for painting):
Inside the Main section below, we can see all the processes happening and what triggers each of them:
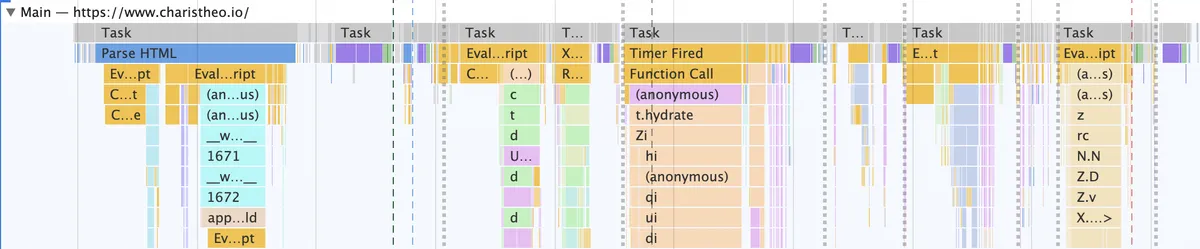
The Main section above represents the main thread of your browser and lists all the processes that we are interested in when optimising for Layout. The processes being executed inside the main thread are, for example, script evaluation, HTML parsing, Layout, and Paint.
It would be out of scope to explain all of the bits inside the Performance tab. It’s better to focus on the task at hand: the layout process. Look for the chunks coloured in purple, and try to find what is causing them by looking at the bottom of the Call Tree, found on the bottom tabs.
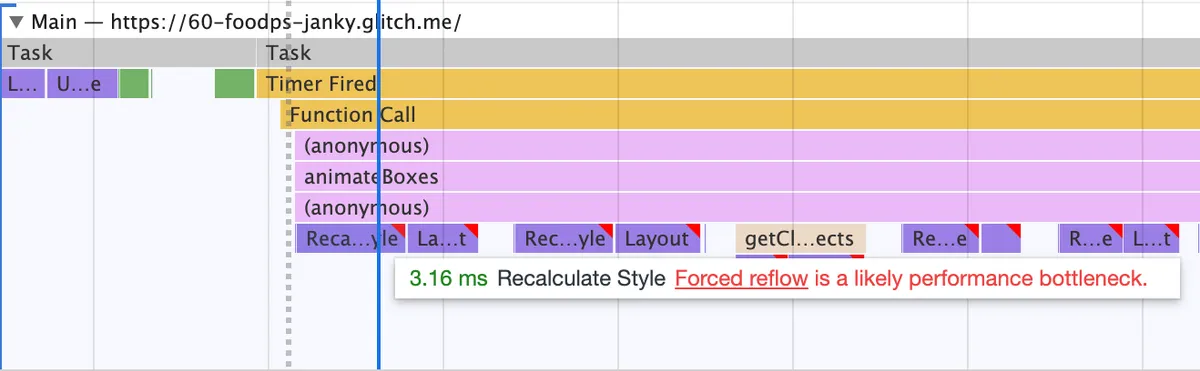
The red ribbons in the above screenshot indicate rendering performance issues that need addressing.
Try digging around, in the Bottom-Up and Call Tree tabs, and you should be able to extract some valuable information about which processes within JavaScript take too long, where they start from, and then you can decide on how to optimise. Read more about analysing runtime performance in this article in Google Developers.
Additionally, watch the following YouTube video for a general explanation on how to use the Performance tab (skip to 9:55)
Analyse the FPS chart and Frames section#
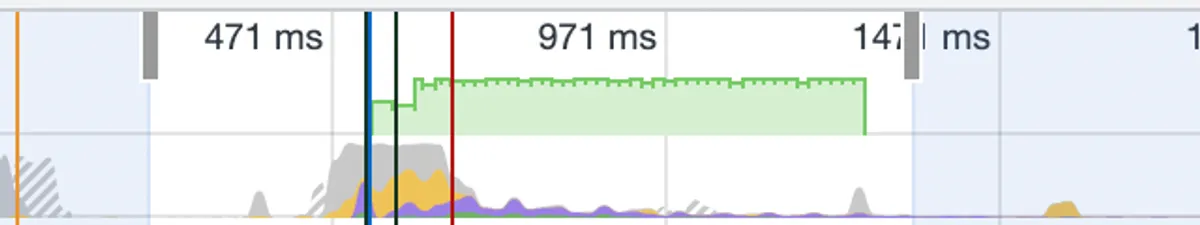
Within the Performance tab there are another two sections that can be useful when measuring FPS, especially for identifying which frames took longer than the 16 ms mark.
After recording an interaction or after a page reload, we get a Frames section that lists all frames lapsed and how long each frame took:
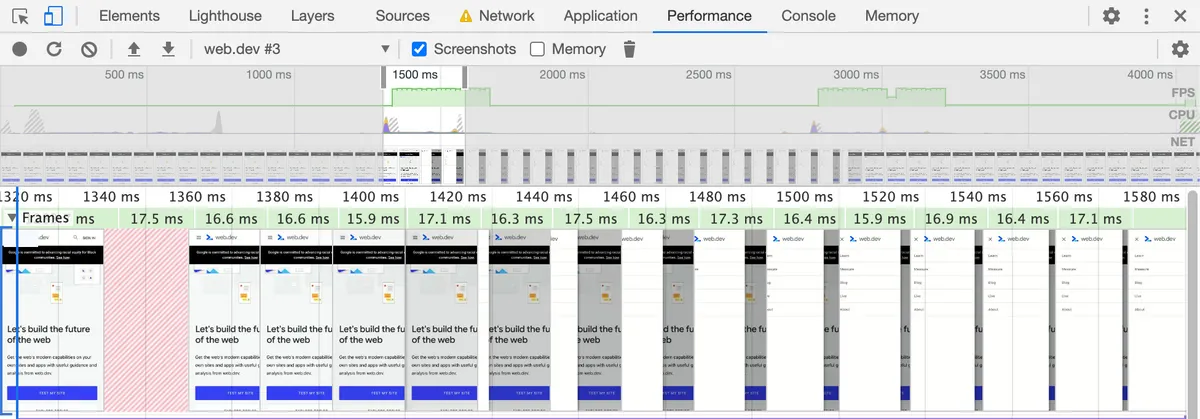
For an in-depth performance analysis reference of the Performance tab head to this article.
Using the Layers tab in Chrome DevTools#
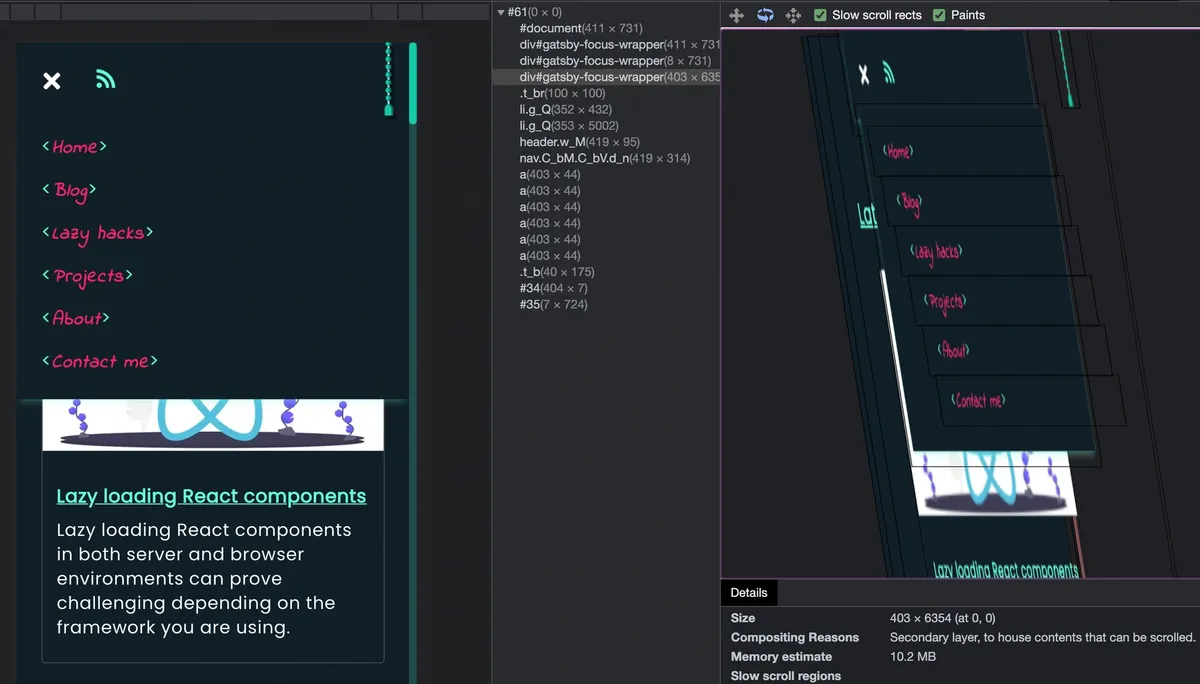
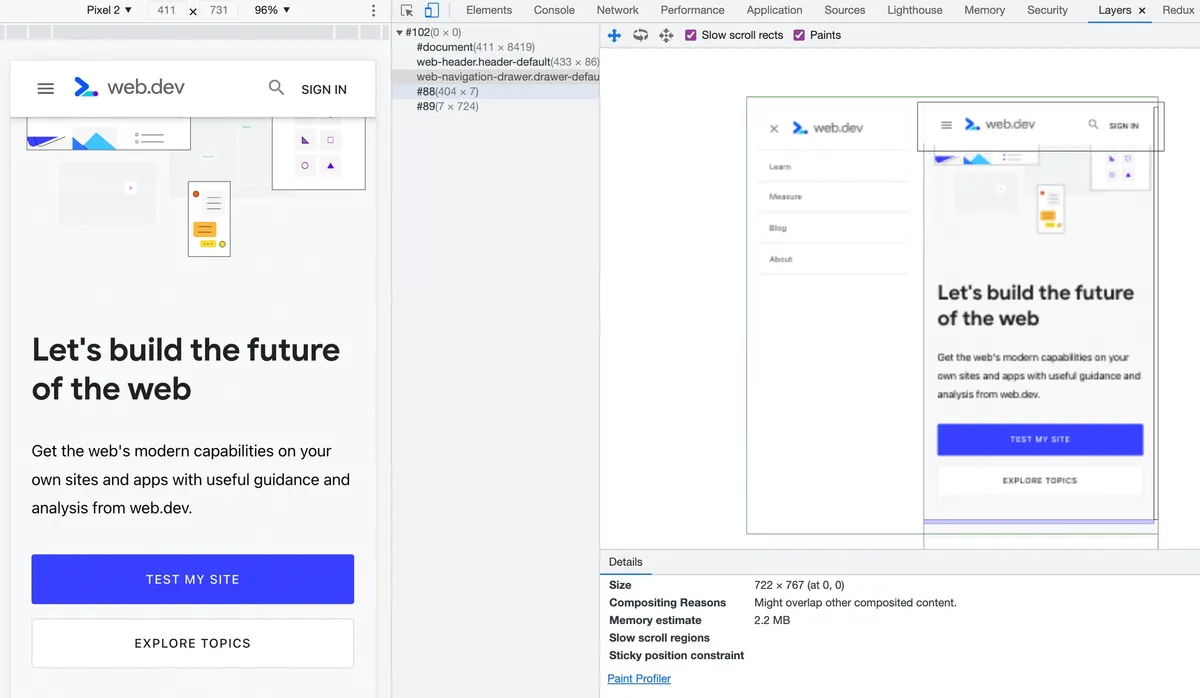
The Layers tab of Chrome DevTools can help us identify which elements have been promoted to their own layers, whether by the Chrome engine or manually (e.g. after adding will-change: position to an element).
It is also useful in cases you want to check on a hidden or offscreen element’s composition details. Take as an example the web.dev navigation menu as shown in the following screenshot:
Tip: To open the Layers tab in Chrome DevTools, press cmd + shift + P on macOS ( ctrl + shift + P on Windows) to bring up the Command Palette. Then type "layers" to search and choose the "Show Layers" option or watch this quick walkthrough video.
We can inspect why the navigation menu element has been promoted to a new layer by looking at the "Compositing Reasons" section. This inspection will help us understand whether or not this element will cause Layout when toggled and if our optimisations have been successful.
Conclusion#
Layout and Layout thrashing should always be kept at a minimum in order to increase perceived page speed and provide a fluid, non-blocking user experience.
The techniques described in this article are more of a coding style and common best practises rather than a to-do list so make sure you are doing what’s necessary to incorporate such practises in your daily coding processes.
Hope you found this article useful and that you can make your fast website feel even faster 🚀
Further reading#
- Stick to Compositor-Only Properties and Manage Layer Count - Google Developers
- Avoid Large, Complex Layouts and Layout Thrashing - Google Developers
- Measure performance with the RAIL model - web.dev
- Rendering Performance - Google Developers
- 60fps Layout and Rendering - Google Dev Summit 2013
- In the loop by Jake Archibald - JSConf.Asia
- Correlating On-Click Rendering Performance and CvR - simplified.dev
More on measuring Frames per second#
- Frame Timing API - Web APIs | MDN
- Frame rate - Firefox Developer Tools | MDN
- Smoothness API polyfill - Github